

SIMS Analyses for Boron
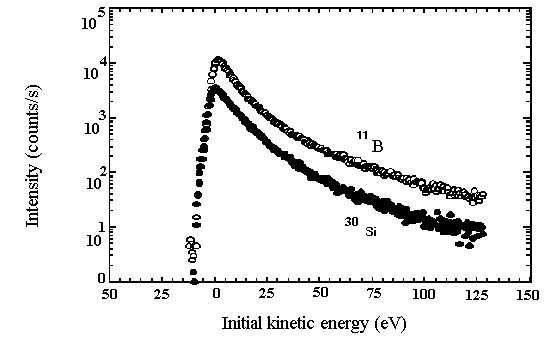 Figure 1. Secondary ion energy spectra for 11B+ and 30Si+
sputtered from a reedmergnerite glass (NaBSi3O8; sample from Hervig and Navrotsky,
1985). Initial kinetic energy of the secondary ions vs. ion intensity. Note
the peak of intensity at a few eV for both B and Si, and the tailing off
of intensity for higher energy ions. Step size = 0.5 eV.
Figure 1. Secondary ion energy spectra for 11B+ and 30Si+
sputtered from a reedmergnerite glass (NaBSi3O8; sample from Hervig and Navrotsky,
1985). Initial kinetic energy of the secondary ions vs. ion intensity. Note
the peak of intensity at a few eV for both B and Si, and the tailing off
of intensity for higher energy ions. Step size = 0.5 eV.
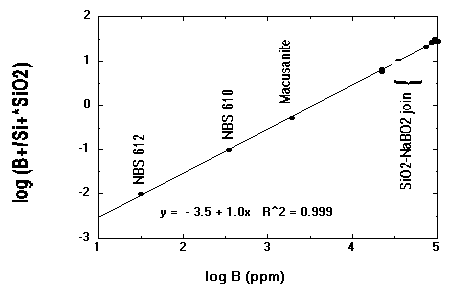
Figure 2. Calibration curve for boron in glasses. The logarithm
of the B concentration (ppm by weight) vs. the logarithm of the B+/Si+ ratio
(normalized to 100% isotopic abundances) multiplied by the SiO2 content (in
wt. %). NBS 610 and 612 contain 351 and 32 ppm B, respectively, while macusanite
contains 1926 ppm B. Glasses along the SiO2- NaBO2 join (from Hervig and
Navrotsky, 1985) range from 2.1 to 9.9 wt. % B. SIMS analyses are from
Hervig (1985) for the SiO2-NaBO2 glasses and Hervig (unpublished data)
for the others. The former data were obtained while collecting secondary
ions with 50-180 eV excess kinetic energy, while the NBS glass and macusanite
data represent secondary ions with 55-95 eV excess kinetic energy. Approximately
9 years passed between collecting the two sets of data.
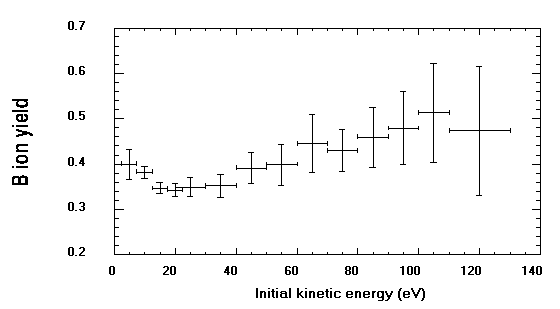
Figure
3. Ion yields for boron as a function of secondary ion initial kinetic energy
(eV). Yields were calculated from the B+ and Si+ intensities on Fig. 2. The
B/Si intensity ratios were corrected for isotopic abundance and normalized
to the B/Si atomic ratio in the glass. Ion ratios over 4 to 20 eV ranges
were integrated to increase precision, because count rates were low at high
secondary ion energies. The horizontal error bar shows the ranges used, while
the vertical error bar represents one standard deviation of the mean ion
yield calculated on the 5-20 steps.