SIMS Analyses for Hydrogen
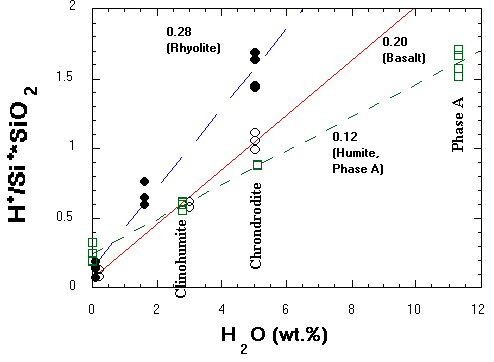
The figure below shows the calibration for H in different phases of geologic interest. The analyses were collected on the ASU 3f using an O- primary beam (1-2 nA) at an impact energy close to 17 keV. Positive secondary ions were detected using the 150 micron transfer optics and only those ions with excess kinetic energies between 55-95 eV (relative to the centroid of the Si30-energy plot) were allowed into the mass spectrometer. The H+/Si+ ion ratios were not normalized for isotopic abundance but were normalized to the silica abundance. Rhyolites and pantellerites appear to define the greatest slope, while basalts (and amphiboles and staurolites) define a smaller slope. Humite minerals, including Phase A and one biotite (not shown, and this remains to be confirmed by using other micas) define the smallest slope. Note the different H background obtained during analyses of the humite minerals. The relative ion yield for H from the basaltic glasses is similar to that observed for ion implanted forsterite (Kurosawa et al., 1992, In, High-Pressure Research: Application to Earth and Planetary Sciences, edited by Y. Syono and M.H. Manghnani, pp. 283-287) assuming that their analyses with a 100V offset can be compared to ours at 75V by decreasing the yield by ~30%.
For further information about SIMS analyses of volatiles in geologic phases,
see Chapter 2, "Analytical methods for volatiles in glasses", by
P.D. Ihinger, R.L. Hervig, and P.F. McMillan in "Volatiles in Magmas",
Reviews in Mineralogy, 1994, Volume 30. Editors: M.R. Carroll and J.R. Holloway.
Published by the Mineralogical Society of America.


