Cause of chemical zoning in the Bishop (California) and Bandelier (New Mexico) magma chambers
Earth and Planetary Science Letters, 111 (1992) 97-108 Elsevier
Science Publishers B.V., Amsterdam
Richard L. Hervig* and Nelia W. Dunbar**
*Center for Solid State Science Arizona State University Tempe, AZ 85287-1704
**Department of Geosciences New Mexico Institute of Mining and Technology Socorro, NM 87801 Received March 1991; revised version received February 1992
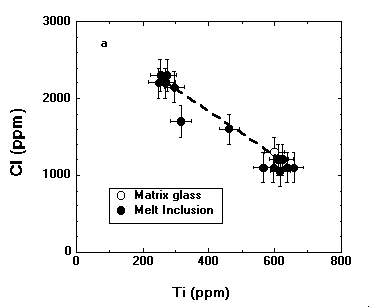
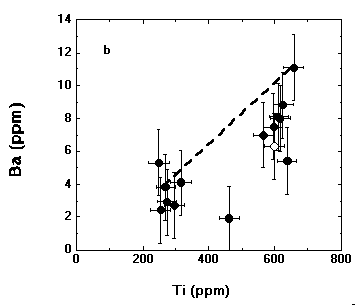
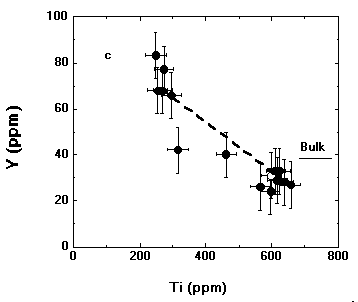
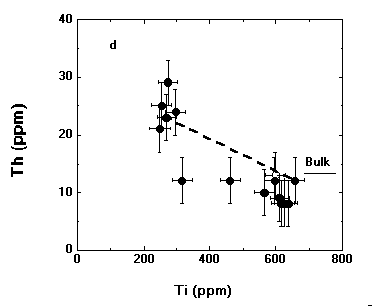
Rhyolitic magma chambers often erupt to form deposits with a wide range of trace element chemistry, inferred to reflect zoning in the magma chamber prior to eruption. Ion probe microanalyses of trapped melt inclusions and matrix glass from the large Lower Bandelier Tuff and Bishop Tuff eruptions shows that much of this compositional variation can be blamed on the intrusion of a second rhyolitic magma into the base of the chambers. The second rhyolite was composed of similar major elements but contained significantly higher Ti, Sr, and Ba in both examples. Microanalyses of sanidine phenocrysts show pronounced trace element zoning profiles in accord with the glass chemistry. Applying the available diffusion coefficients for Sr in sanidine to the zoning suggests residence times on the order of 10,000 years after the mixing event. The source of the second magma is not known, but similarities in chemical zoning patterns in silicic magmas throughout the world point toward a common process. Mixing of less fractionated magma derived from similar source rocks is the simplest mechanism. Detailed isotopic studies may help distinguish different sources. Independent of the second magma, large variations in trace elements are observed in the melt inclusions from the Lower Bandelier and Bishop Tuffs which can be modeled by ~ 40% fractional crystallization. The attached figure of melt inclusions from a single pumice lump shows some of the strongest evidence for magma mixing.
(a)

(b)

(c)

(d)

Fig. 2 Variation of chemistry in melt inclusions (filled circles) from sample 030 from a pumice lump in the ignimbrite of the Lower Bandelier Tuff. The open circle represents matrix glass and the dashed line connects two inclusions in the same quartz phenocryst. (a) Variation of Ti with Cl. (b) Variation of Ti with Ba, legend as in (a). (c) Variation of Ti with Y, legend as in (a). (d) Variation of Ti with Th, legend as in (a).


